Tennessee BBS 4: Flycatchers to Corvids
Eastern Wood-Pewee
 35 year change: +1.43 (+22%) ± 0.65
Pewees showed a statistically significant modest upward trend in numbers on BBS routes in Tennessee, though this appears to have primarily occurred in the 1975-1990 period. Recent data suggest a possible slight decline.
Acadian Flycatcher
 35 year change: +1.32 (+50%) ± 0.50
Tennessee's only widespread Empidonax species has increased significantly, especially since 1990. Though this may in part be an "Appalachian bump," the upward trend appears to be sustained up to the present
Willow Flycatcher
 35 year change: -0.01 (-18%) ± 0.02
Very limited data from a small number of routes showed no significant change in numbers of this uncommon and local nesting species.
Least Flycatcher
 35 year change: -0.03 (-81%) ± 0.02
Also uncommon, local, and with very limited data, the Least Flycatcher nonetheless showed a statistically significant downward trend. The skimpy data do not necessarily indicate an ecologically meaningful trend, however.
Eastern Phoebe
 35 year change: +3.89 (+147%) ± 1.02
Phoebes have shown a dramatic increase on Tennessee BBS routes, especially since about 1985.
Great Crested Flycatcher
 35 year change: +1.10 (+48%) ± 0.42
This species has also increased steadily, though less dramatically, throughout the BBS period.
Eastern Kingbird
 35 year change: -0.24 (-5%) ± 0.70
Kingbird numbers have remained relatively stable on Tennessee BBS routes over the period.
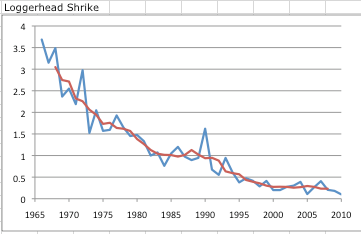
Loggerhead Shrike
 35 year change: -2.31 (-90%) ± 0.54
As has been widely noted, shrikes have declined drastically and exponentially over the BBS period. There are hints that his decline may have stabilized in the last decade or so; even if it has, it still represents a huge decline from the 1966 levels.
White-eyed Vireo
 35 year change: +3.57 (+72%) ± 1.54
All five species of Vireos recorded on Tennessee BBS routes have shown substantial and statistically significant increases over the period. In the case of the White-eyed this appears to have taken the form of a rapid rise beginning rather suddenly in the 1990s.
Yellow-throated Vireo
 35 year change: +1.01 (+66%) ± 0.32
This species has shown a steady, modest increase over the BBS era.
Blue-headed Vireo
 35 year change: +0.16 (+195%) ± 0.07
Primarily restricted as a breeder to the eastern parts of Tennessee, the Blue-headed Vireo has increased dramatically since the early 1980s. This rise began well before the "Appalachian bump" period of the early 1990s and continues steadily to the present. This puts the apparent nesting pair I found in Lewis County in 2010 (well to the west of the typical breeding range) in context.
Warbling Vireo
 35 year change: +0.52 (+363%) ± 0.14
In contrast to the Blue-headed, the Warbling Vireo is primarily a bird of west Tennessee. It has shown an even more dramatic increase in numbers, rising steadily from near zero in the 1960s to being widespread, even abundant on some routes, in recent years.
Red-eyed Vireo
 35 year change: +6.05 (+77%) ± 1.07
This most ubiquitous vireo in Tennessee rose in number steadily from 1966 until about 1995, then apparently reached a plateau or even began a slight decline.
Blue Jay
 35 year change: -6.94 (-34%) ± 2.35
Blue Jays are not at their most conspicuous during the BBS season but nevertheless they are detected in large numbers on nearly all routes. The average counts have declined modestly but steadily over the decades. I found it interesting that there is no noticeable effect of the arrival of West Nile Virus in the early 2000s; the decline was ongoing before then and has continued at about the same rate since.
American Crow
 35 year change: +11.78 (+43%) ± 2.36
One of the most conspicuous and ubiquitous birds on the Tennessee BBS, American Crows have increased modestly over the period. Again, there is no noticeable West Nile Virus effect.
Fish Crow
 35 year change: +0.05 (+175%) ± 0.06
The "other" crow is only recorded in small numbers on a few Tennessee BBS routes. The apparent upward trend is not statistically significant overall, which is more a reflection of limited data than an indicator of real stable populations.
Common Raven
 35 year change: +.03 ± 0.02
Ravens did not appear on the Tennessee BBS until the 1990s, and have been recorded in small numbers on a very few routes in east Tennessee in most years since then. There is a suggestion of a continuing upward trend but the data are too limited to evaluate this statistically.
Tennessee BBS index:
Introduction
1: Waterfowl to Herons
2: Vultures to Doves
3: Cuckoos to Woodpeckers
4: Flycatchers to Corvids
Next: 5: Larks to Wrens
6: Gnatcatchers to Waxwings
7: Wood Warblers
8: Towhees to Buntings
9: Icterids to House Sparrow
Ups and Downs
Habitats
Inflection Points
Summary


0 Comments:
Post a Comment
<< Home