Tennessee BBS 7: Wood Warblers
Ovenbird
 35 year change: -0.36 (-18%) ± 0.43
Ovenbird numbers on Tenneessee BBS routes have fluctuated, but the overall change is not significantly different from zero.
Worm-eating Warbler
 35 year change: +0.24 (+69%) ± 0.17
Worm-eating Warblers have shown a fairly steady increase in Tennessee over the BBS era.
Louisiana Waterthrush
 35 year change: +0.17 (+22%) ± 0.18
Though the overall trend is not significant, Louisiana Waterthrush numbers appear to have dropped substantially between 1966 and 1980 then recovered steadily.
Blue-winged Warbler
 35 year change: +0.12 (+35%) ± 0.17
The numbers of Blue-wings have remained relatively stable over the BBS period. The upswing in the last few years is due primarily to large counts on a few of stops on one route (Collinwood) where a large area of old clearcuts has reached the proper successional stage. It does not seem to be part of a large-scale trend.
Golden-winged Warbler
 35 year change: -0.14 (-89%) ± 0.08
Never widespread, Golden-winged Warblers have declined steadily to the point that they have not been recorded at all since 2007.
Black-and-white Warbler
 35 year change: -0.42 (-41%) ± 0.17
Numbers of Black-and-white Warblers have declined substantially over the BBS period. These data also illustrate the "Appalachian bump" that will be a prominent feature in the data for several more species below. In the early 1990s there was a sharp increase in the detection of many woodland species on eastern Tennessee routes. This appears to have been more of an observer effect than a real change in populations. It complicates the interpretation of trends for species that occur primarily or exclusicely in the eastern mountains.
Swainson's Warbler
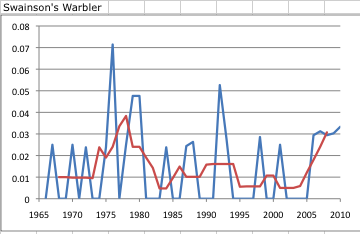 35 year change: +0.01 (+83%) ± 0.02
Swainson's Warblers have been recorded in low numbers throughout the period, with no statistically significant trend discernable.
Kentucky Warbler
 35 year change: +0.11 (+5%) ± 0.46
Though not abundant, Kentucky Warblers are widespread and have shown no significant trend in numbers over the BBS era.
Common Yellowthroat
 35 year change: -3.16 (-23%) ± 0.93
Yellowthroats have shown a steady modest decline throughout the period. Even with the decline they have been one of the two most numerous warblers on Tennessee BBS routes throughout the period.
Hooded Warbler
 35 year change: +0.83 (+74%) ± 0.37
Though Hooded Warbler counts have shown a statistically significant upward change, it appears that this may primarily a function of the "Appalachian bump" in the early 1990s, with flat numbers before and after the bump.
American Redstart
 35 year change: -0.60 (-65%) ± 0.36
Redstart numbers have shown a substantial drop in spite of a significant "Appalachian bump" effect.
Cerulean Warbler
 35 year change: -0.39 (-48%) ± 0.24
Similarly, Cerulean numbers have also dropped significantly even with a large "Appalachian bump." The data from 2009 and 2010 show a drastic drop; hopefulyl this will be reversed with 2011 data.
Northern Parula
 35 year change: +2.93 (+881%) ± 0.62
Parula numbers appear to be growing exponentially, with about a 10-fold increase over the BBS period. They have now climbed to the point that they are the third most abundant wood warbler on Tennessee BBS routes, after Common Yellowthroat and the (probably not really a warbler) Yellow-breasted Chat.
Blackburnian Warbler
 35 year change: +0.01 (+153%) ± 0.03
Blackburnians have been recorded in small numbers on very few routes. No significant trend is discernable from the limited data.
Yellow Warbler
 35 year change: -1.78 (-87%) ± 0.26
Yellow Warblers have shown a steady, severe decline over the period, with a drop of nearly 10-fold.
Chestnut-sided Warbler
 35 year change: +0.08 (+90%) ± 0.05
This is perhaps the most confusing instance of the "Appalachian bump." Numbers appeared to decline, then rose sharply in the "bump" time, with additional declines after the bump. The overall change is significantly positive, but one suspects that the bump is in fact masking an underlying long-term decline. This is where the much more refined analyses used by the BBS researchers are far more powerful than my simple approach. In the Appalachian region of Tennessee there are just not enough routes to average out the observer effects and other biases, which do appear to come out in the wash for more widespread statewide species.
Black-throated Blue Warbler
 35 year change: +0.03 (+28%) ± 0.04
Black-throated Blues were found in too small numbers and on too few routes to discern a significant trend.
Pine Warbler
 35 year change: +1.05 (+418%) ± 0.19
Pine Warbler numbers rose steadily through 1990. with an especially rapid rise beginning in 1985. Since 1990 numbers seem to have been roughly stable. This increase would seem likely connected to pine conversion forestry practices.
Yellow-throated Warbler
 35 year change: +2.28 (+194%) ± 0.44
Numbers of this species rose steadily and substantially until the late 1990s, and appear to have stabilized since then.
Prairie Warbler
 35 year change: -1.10 (-37%) ± 0.53
Prairie Warblers showed s steady, moderate decline until about 1990, with stable or slightly increasing counts since then.
Black-throated Green Warbler
 35 year change: +0.46 (+104%) ± 0.24
Similar to the Chestnut-sided, this is another case where a large "Appalachian bump" seems to be obscuring what may be an overall declining trend. Numbers appear to have fallen off a cliff in 2010; the data from 2011 will illuminate whether this was just a fluke or a real event.
Canada Warbler
 35 year change: +0.36 ± 0.18
Canada Warblers were found only on the Fish Springs route and only in the "Appalachian bump" period. Though the increase is statistically significant, it is probably not meaningful.
Yellow-breasted Chat
 35 year change: -5.10 (-31%) ± 1.09
This anomalous warbler (which is probably not really a warbler) shows a pattern very similar to that shown by the Prairie Warbler, with which it shares many habitat preferences. Counts declined modestly until about 1990, then stabilized or perhaps rebounded somewhat. Even with the decline, Chats have been one of the two most abundant warblers on the Tennessee BBS throughout the period.
Tennessee BBS index:
Introduction
1: Waterfowl to Herons
2: Vultures to Doves
3: Cuckoos to Woodpeckers
4: Flycatchers to Corvids
5: Larks to Wrens
6: Gnatcatchers to Waxwings
7: Wood Warblers
Next: 8: Towhees to Buntings
9: Icterids to House Sparrow
Ups and Downs
Habitats
Inflection Points
Summary
posted by Bill Pulliam @ 6:01 PM
0 comments
![]()
![]()